


Are you aware of the number of users who abandon their carts on your sites and how it will impact your bottom line?
If not, then you are missing out on a significant revenue opportunity.
To understand why customers are abandoning their shopping carts, it's important to calculate your cart abandonment rate.
This will let you know how often it happens and may provide insight into what might be causing people not to finish checkout.
In this article, you will discover how to calculate your cart abandonment rate and how to fix it to increase sales.
What is Shopping cart abandonment rate?
The shopping cart abandonment rate is the percentage of shoppers who add items to their cart and then leave without buying anything.
Measuring this metric is essential as it helps you understand the extent of your conversion rate. The higher the shopping cart abandonment rate, the lower your conversion rate, and vice versa.
What is the average abandoned cart recovery rate?
The Baymard Institute compiled data from 41 studies and found that the average cart abandonment rate is under 70 percent.

This means 7 out of 10 shoppers who added items to their cart never completed their purchase. Though this is a huge number, there are still ways to decrease it by leveraging effective abandoned cart recovery strategies.
You can identify where your customers are dropping off and create a plan to get them back in the cart.
Here are some of the most common reasons why shoppers abandon their carts:
- They don’t see a discount on an item they want to buy.
- The checkout process is too long or complicated.
- They didn’t find suitable shipping options (e.g., free shipping).
- They don’t have enough product information or don’t find it trustworthy (e.g., reviews).
- They don’t feel confident it will arrive in good condition (e.g., returns policy).
- They think the price is too high.
To find the problem and fix it, you can use a tool like BiteSpeed. It lets you nudge these potentially lost sales into customers or even ask for feedback when they abandon their carts via WhatsApp.

Based on their responses, you can set up a WhatsApp marketing workflow to help your customers finish their purchases.
For example, you can ask them what’s preventing them from buying. You can send them a discount code or free shipping if cost is their primary concern.
This way, you can offer your customers a better deal and help them complete their purchase.
How to calculate cart abandonment rate? The Cart abandonment rate formula
The Shopping cart abandonment rate is calculated by dividing the number of customers who finished their purchases by the total number of carts created.

For example, if you have 100 total shopping cart creations and 20 are abandoned, your cart abandonment rate is 20%. You can also measure it by dividing the number of abandoned carts by the number of customers who reach checkout.
How to Calculate abandoned carts using Google Analytics?
Though you can always use the formula to calculate cart abandonment rate, Google Analytics provides a quick way to measure it.
Here’s how:
Step 1: Set your goals.
To begin, log in to your Google Analytics account and access the Admin tab at the bottom of the homepage. Once on this page, choose Account, Property, and View from the dropdown and click on Goals—located at the far right of the screen.

Goals are preset objectives that help you measure website visitors' completion of specific actions. You can choose from a template or customize the goal settings to reflect your needs best.
Step 2: Name your goal.
The first thing you will need to do is give your goal a name.
Make sure it's clear and descriptive—something like "Order Placed" or "Checkout Complete"—so that when someone hits this goal, you can know what action was taken by the user on your website.
Make sure to select Destination as the type.
Copy-paste the URL to your site's Thank You or confirmation page under Destination. Set the dropdown to Begin With and enter only that part of the URL that does not change on every order.
E.g., Only input this part: https://www.yourwebsitehere.com/success/checkout/

Step 3: Set up the funnel.
Finally, add links to every step in your checkout process.
A basic funnel would include,
- The cart page (where customers fill their shopping carts),
- The checkout page (where they enter payment information), and
- An order confirmation or receipt email.
However, some websites have additional steps in the checkout process. Make sure you know how yours works and adjust accordingly—add additional URLs if necessary.

Step 4: Generating reports.
To view your D2C store’s goals in Google Analytics, go to Conversions → E-commerce and select Goals. Data collection takes up to 24 hours, so viewing real-time data isn't possible.
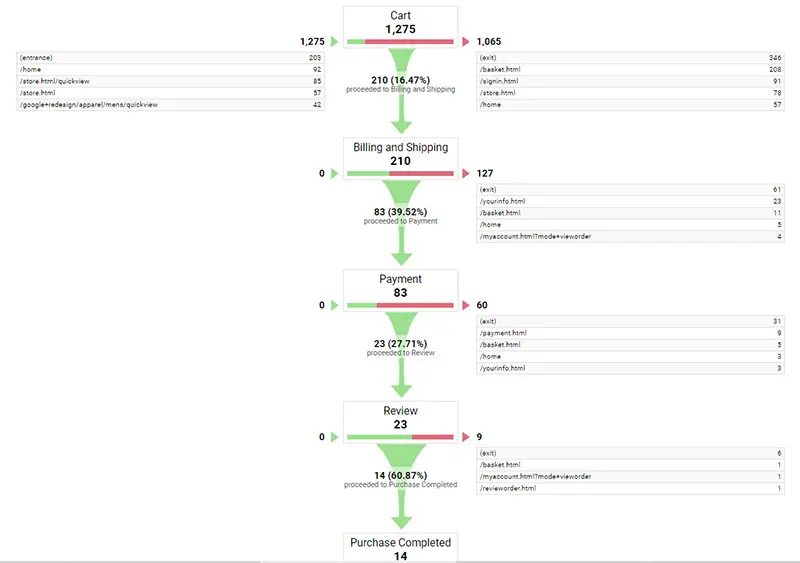
When you click on the Funnel Visualization tab, you can see which pages are in the funnel and how many people have reached each step. The goal is to find where customers are dropping off and create strategies to keep them moving through the process.

You can gain a more profound view by analyzing how your audiences interact with each part of the funnel. Focus on the drop-off rates for specific pages and use that information to determine where to make changes to improve your funnel.
The more data you inspect, the more insights you will gain.
How to Calculate Your Abandonment Rate in Google Analytics 4?
You may ask like, "Why should I use Google Analytics 4 (GA4), instead of GA universal?", and the answer is simple: GA4 is a more powerful tool that can help you better understand your traffic and conversions.
Unlike GA Universal, which focuses on page views, GA4 employs an entirely new sort of event-based measurement; it keeps track of individual elements' performance and contribution—including variants.
GA4 gives you the ability to analyze a user's behavior across multiple metrics, allowing for more comprehensive tracking of your visitors.
Let's see how you can calculate cart abandonment rate with GA4,
Step 1: Setting up funnel exploration.
In Google Analytics 4, click Explore from the left sidebar. The Explorations screen appears. Create a new exploration by clicking on + sign, located at the top of this page.

To begin, type a name for your custom exploration in the Explorations screen. Let’s name it “Abandoned Carts."
Now select, Funnel exploration-->Technique.

Step 2: Establish the sequence.
Next, you can create a list of steps that represent your checkout process. To do this, click the pencil icon next to the Steps on the same page.

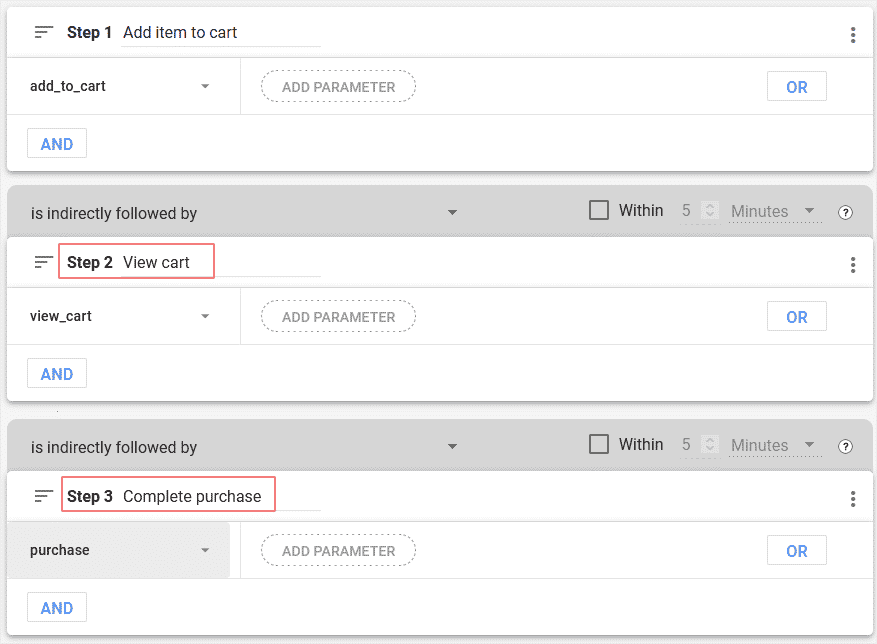
Now assign a name to the first step. It can be simple as "Add item to cart".

Click on the "Add new condition" and choose Events >Add_to_cart.
This metric will show you the number of website visitors who complete their purchases.

To add a new step, click the Add button below the Step 1 box.
Let’s name our steps, and then match the events up again with each step. We want to know how many people added items to their carts, how many of those moved on and reached their cart pages, then finally we'll see which ones actually made purchases
In this example, we named the final two steps “View cart” and “Complete purchase.” We then created conditions that match these actions—with names of view_cart and purchase.
Step 3: View your analytics.
Now that you have added everything to your funnel, click Apply. This will immediately show you what percentage of customers is abandoning the shopping cart and where they are dropping off in the process.

The table shows how many people entered each step of your funnel and how many didn’t progress to the next stage.
So 6.1% of people added items to their carts and then left the site without checking out, but 77.4% looked at their shopping cart before leaving—and didn't buy anything!
Based on this data, you can implement abandoned cart strategies to get these customers back.
For example, suppose you realize that more carts are abandoned on the checkout page. In that case, this could indicate either a problem with your price tag or a suitable payment gateway that customers might not be comfortable paying.
If that's a significant concern, you can send a follow-up WhatsApp message to the customer with a discount code or other payment options to get them to complete their purchase. You can even use the WhatsApp chatbot from BiteSpeed to address your customers' concerns and provide a seamless experience to enhance your conversion rate.
Once you have a clear picture of your funnel, you can start making changes. You can also find out where customers drop off and why they leave. This will enable you to create a better customer experience and increase sales conversions.
Conclusion.
The most important thing you can do is to test and measure. Don’t just assume things are working because they are or because they seem like they should be.
You can even implement a split test on your website to see how different versions of your funnel perform. The more you test, the more data you have, and your funnel will be better.
The key to growing your business is understanding your customers and providing value to them. This is where BiteSpeed comes in.
It allows you to create an automated WhatsApp workflow to help you provide your customers with the best possible experience.
Moreover, leveraging the exit intent popup helps you capture the customers who just hover over the product but don't purchase. So, you can capture and convert people from product abandonment to cart abandonment.
Want to improve your conversion rate with BiteSpeed? Create a free account now and start recovering your abandoned cart for free.


